Gathered data displayed on a Google map using geocoded locations (json file)
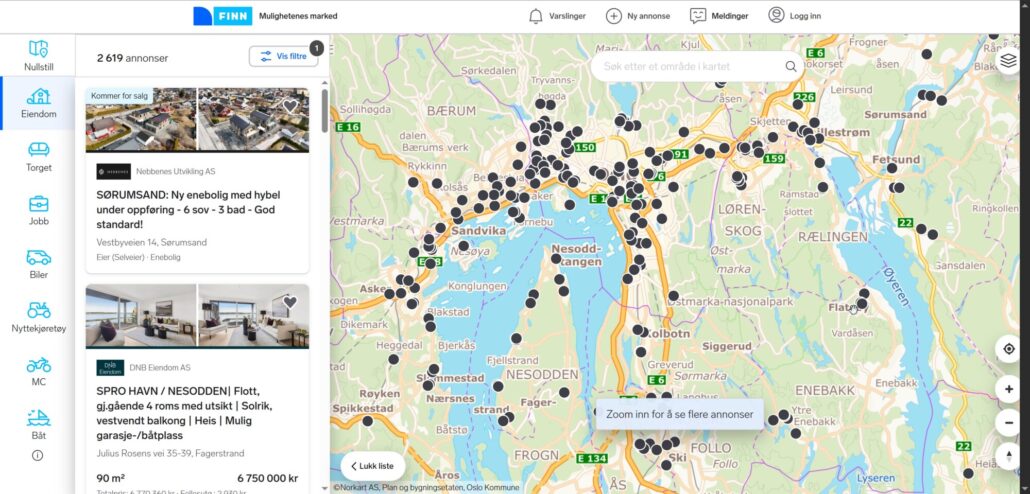
Corresponding finn.no webpage
Online marketplace and ad websites contain a lot of valuable information, specifically about new architectural developments. Finn.no is the biggest such website in Norway and it is common if not standard to post real estate ads and information there.
Finn.no offers an API service, but as I am not a business I decided to go around it and make my own web scraper using Python and Selenium.
Looking at how finn.no web links are formatted, we can see that all the filters and parameters are in the link itself, which is of great help – https://www.finn.no/map/realestate/newbuildings?filters=&lat=59.85704&lon=10.86167&results=true&zoom=9
As this changes the data on the website we can easily change and adapt our scraper – https://www.finn.no/map/realestate/businessrent?filters=&lat=59.75312&lon=10.86585&results=true&zoom=10 (now we have results for office rent)
Example from the dataset:
| Name | Description | Price | URL | Address |
Vestbyveien | SØRUMSAND: Ny enebolig med hybel under oppføring – 6 sov – 3 bad – God standard! | NA | https://www.finn.no/realestate/planned/ad.html?finnkode=399411444 | Vestbyveien 14, 1920 Sørumsand |
Spro Havn – Seilet A – C | SPRO HAVN / NESODDEN| Flott, gj.gående 4 roms med utsikt | Solrik, vestvendt balkong | Heis | Mulig garasje-/båtplass | 6 750 000 kr | https://www.finn.no/realestate/projectsingle/ad.html?finnkode=4042950591 | Julius Rosens vei 35-39, 1454 Fagerstrand |
Bråten | Fagerstrand/Nesodden – Nytt salgstrinn – Leiligheter 80-110m2 – Solrike uteplasser – 2 solgt | 4 895 000 – 6 195 000 kr | https://www.finn.no/realestate/project/ad.html?finnkode=343701712 | Sagstubben, 1454 Fagerstrand |
Usually the prices are displayed either as a range or not available, but the full price table is available on the ad page. We can crawl through the pages again and gather the data:
| Navn | Enhet | Etasje | BRA-i | Soverom | Totalpris | URL Index | Source URL |
Nytt salgstrinn i Ulvenplassen Humleblom borettslag, salgstrinn 2. Salgsstart… | 1025 | 1 | 98 m² | 2 | 9 954 533 kr | 2 | https://www.finn.no/realestate/project/ad.html?finnkode=404292402 |
Nytt salgstrinn i Ulvenplassen Humleblom borettslag, salgstrinn 2. Salgsstart… | 1031 | 1 | 91 m² | 3 | 9 001 313 kr | 2 | https://www.finn.no/realestate/project/ad.html?finnkode=404292402 |
Nytt salgstrinn i Ulvenplassen Humleblom borettslag, salgstrinn 2. Salgsstart… | 2031 | 2 | 98 m² | 3 | 9 404 533 kr | 2 | https://www.finn.no/realestate/project/ad.html?finnkode=404292402 |
Nytt salgstrinn i Ulvenplassen Humleblom borettslag, salgstrinn 2. Salgsstart… | 3003 | 3 | 59 m² | 2 | 5 836 363 kr | 2 | https://www.finn.no/realestate/project/ad.html?finnkode=404292402 |
Nytt salgstrinn i Ulvenplassen Humleblom borettslag, salgstrinn 2. Salgsstart… | 3023 | 3 | 59 m² | 1 | 5 636 593 kr | 2 | https://www.finn.no/realestate/project/ad.html?finnkode=404292402 |
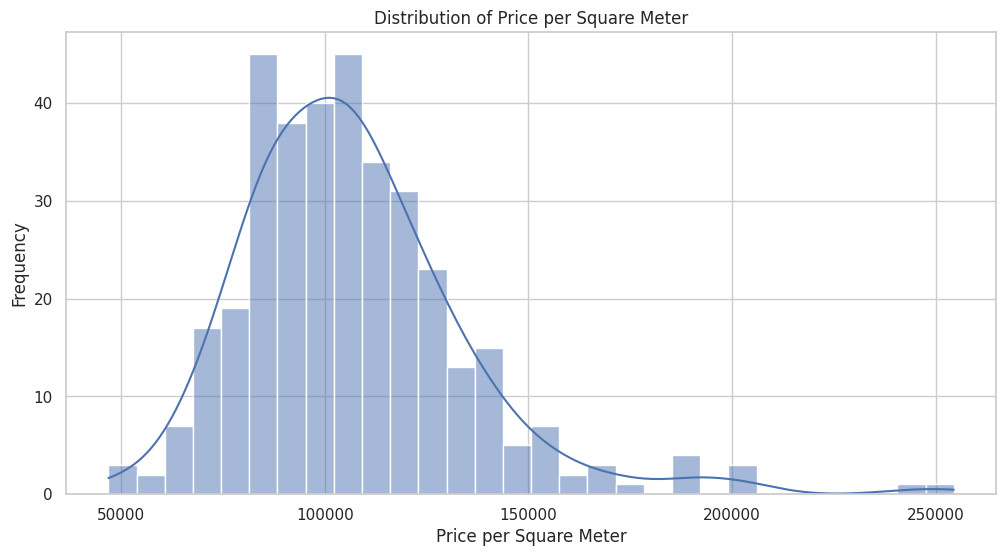
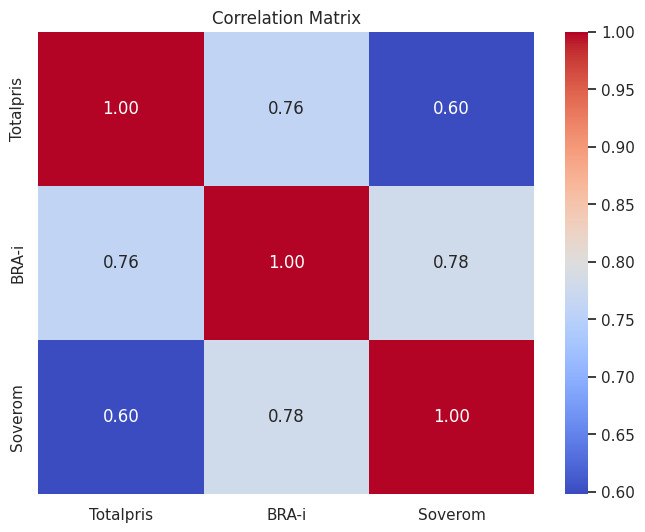
After merging all the data tables together we have 1435 entries of apartment data (including geocoded coordinates for google maps). This now allows us to perform data analysis on the gathered dataset (quick examples):
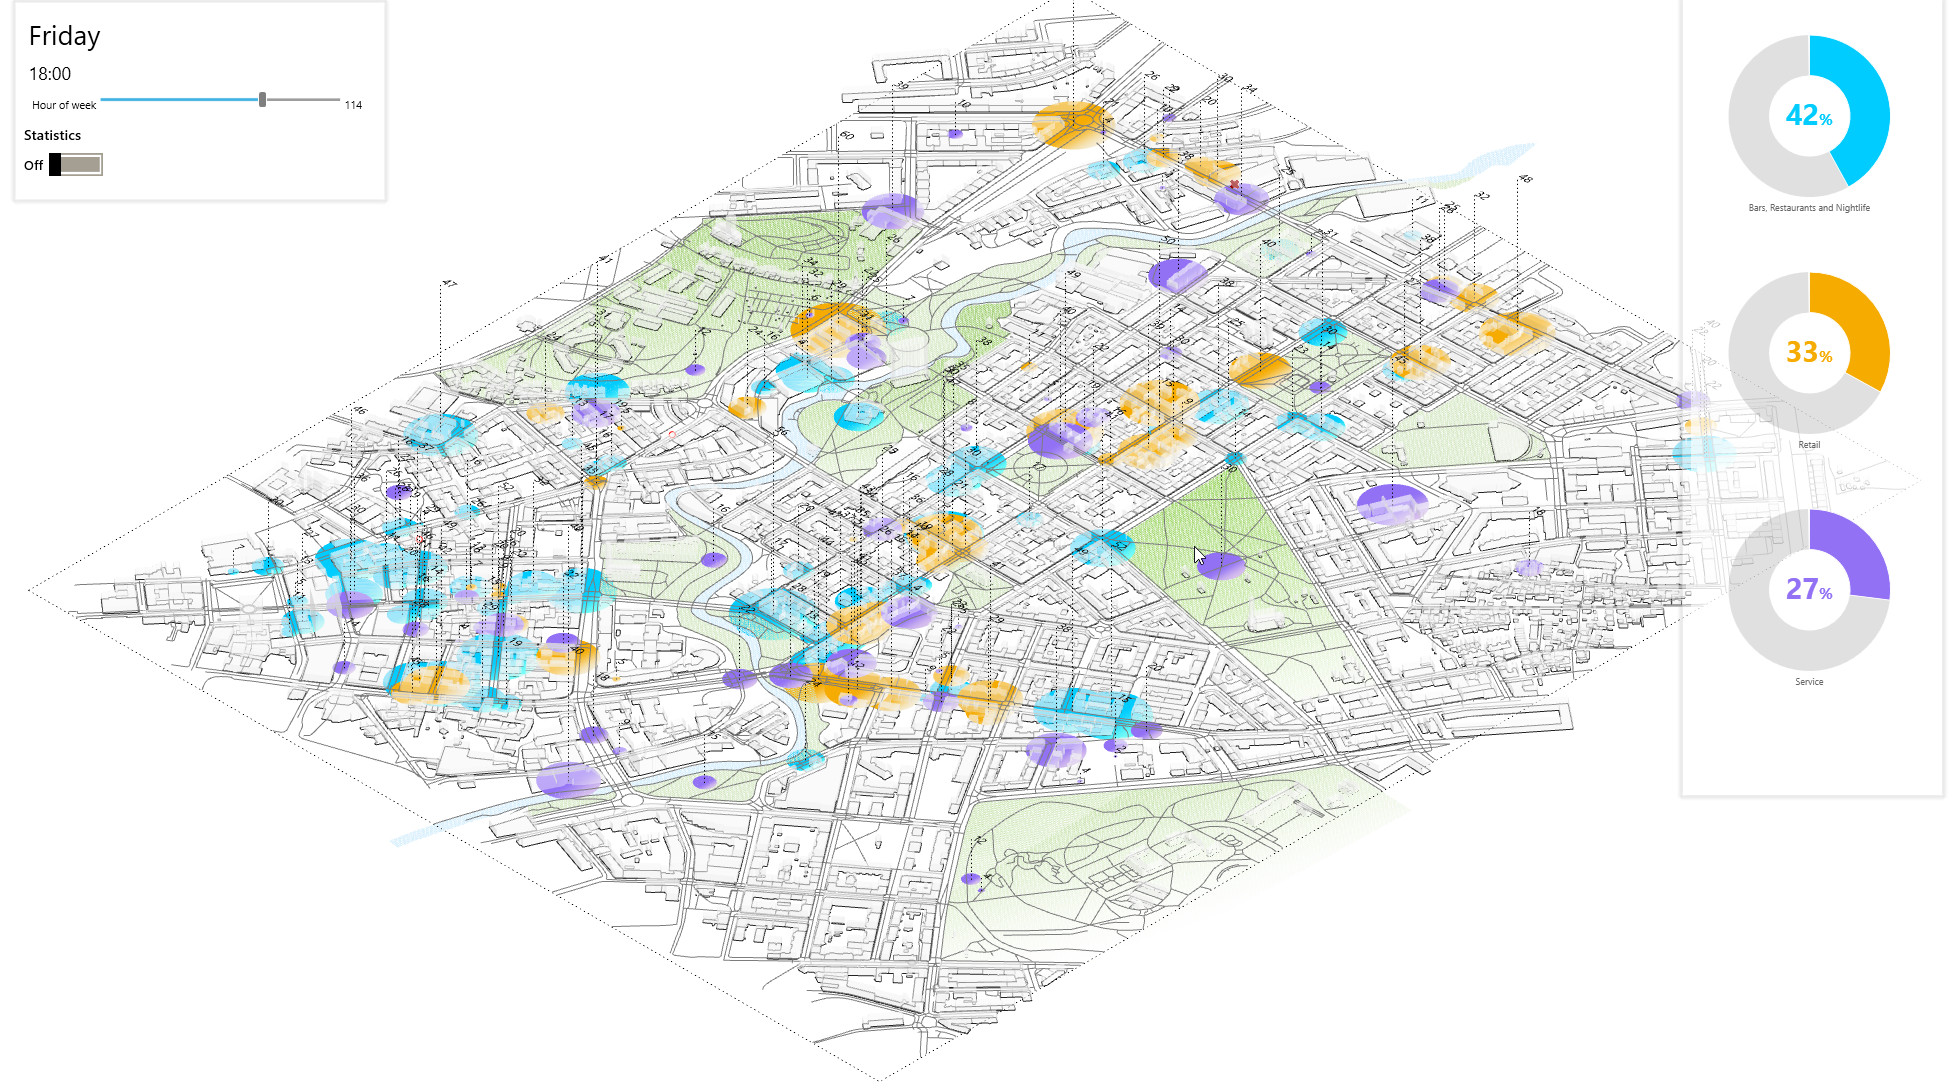
The next step would be to bring all this data into Rhino 3D with grasshopper and / or try out Qgis to better visualise the data, create heatmaps and so on.