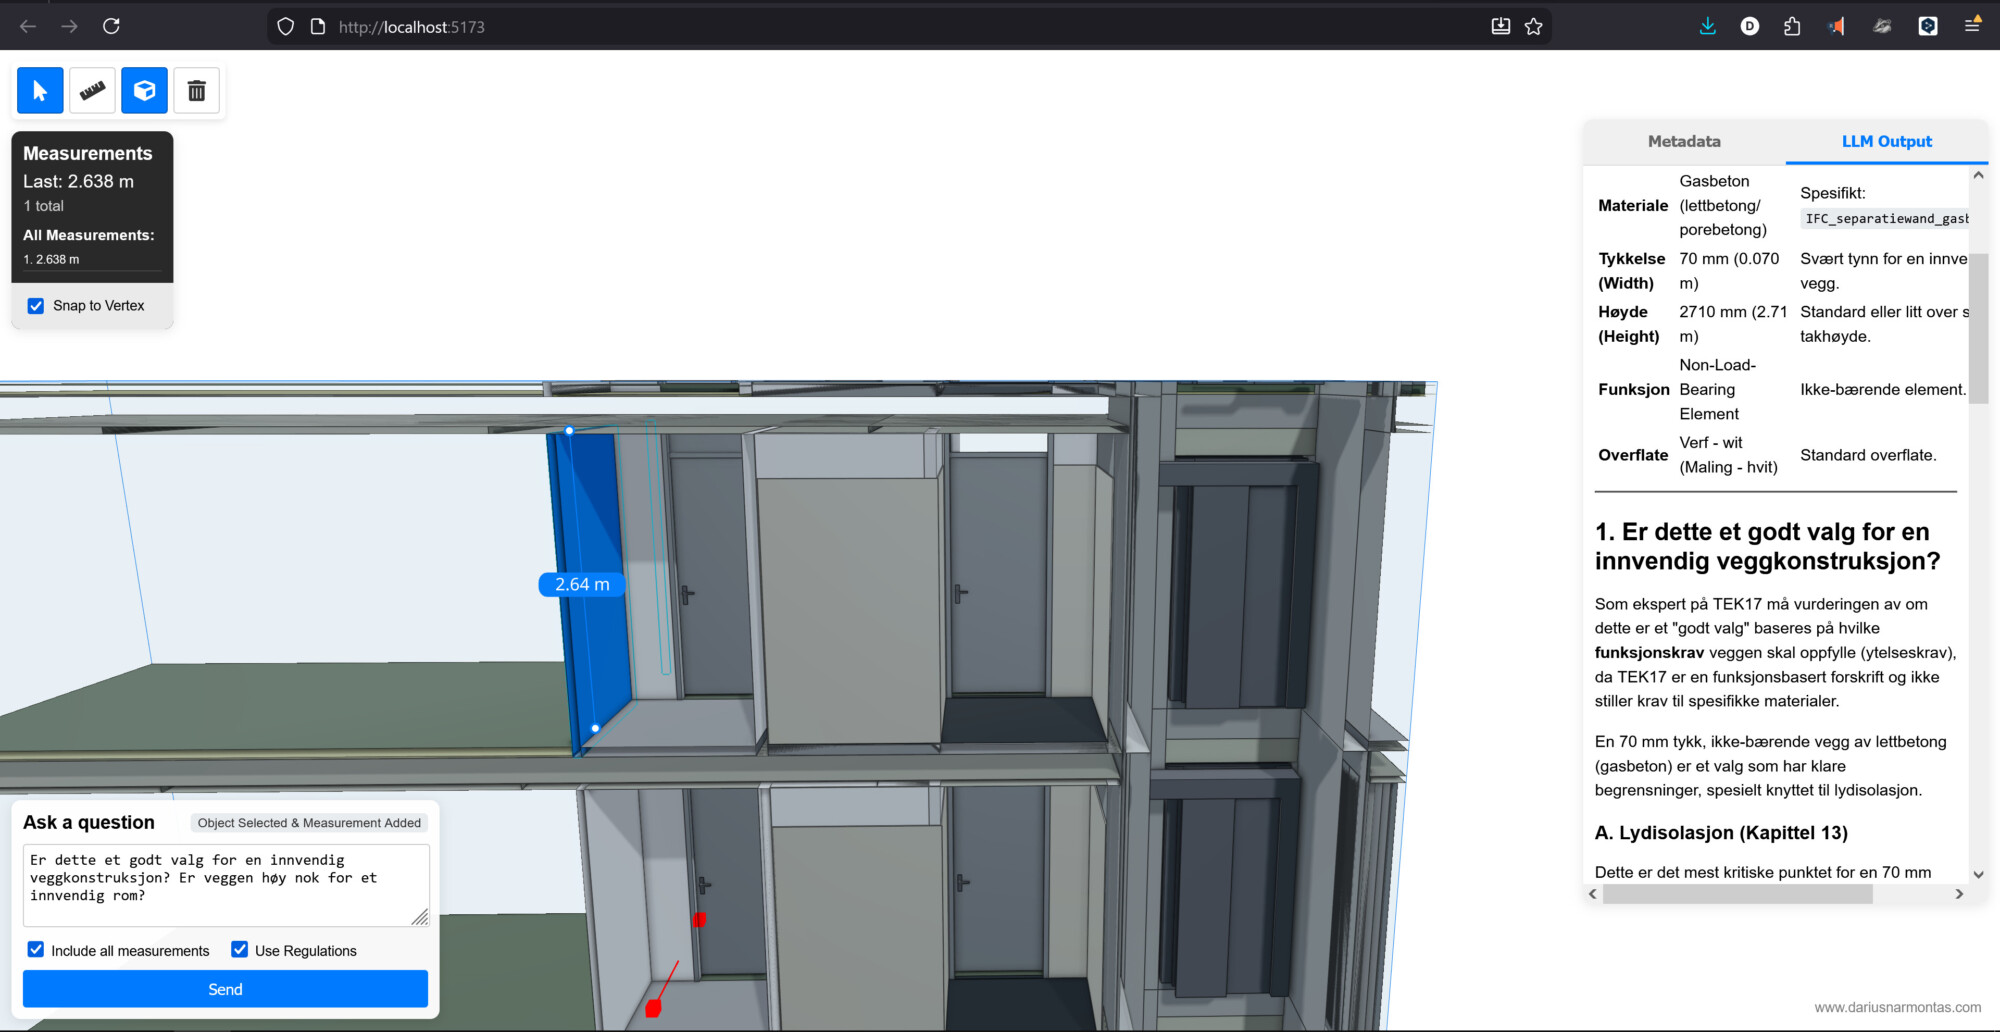
The intent of this exercise was to create an interactive dashboard using Python and Grasshopper in Rhino 3D, in order to visualise and analyse data (including popular times) from the Google Maps API.
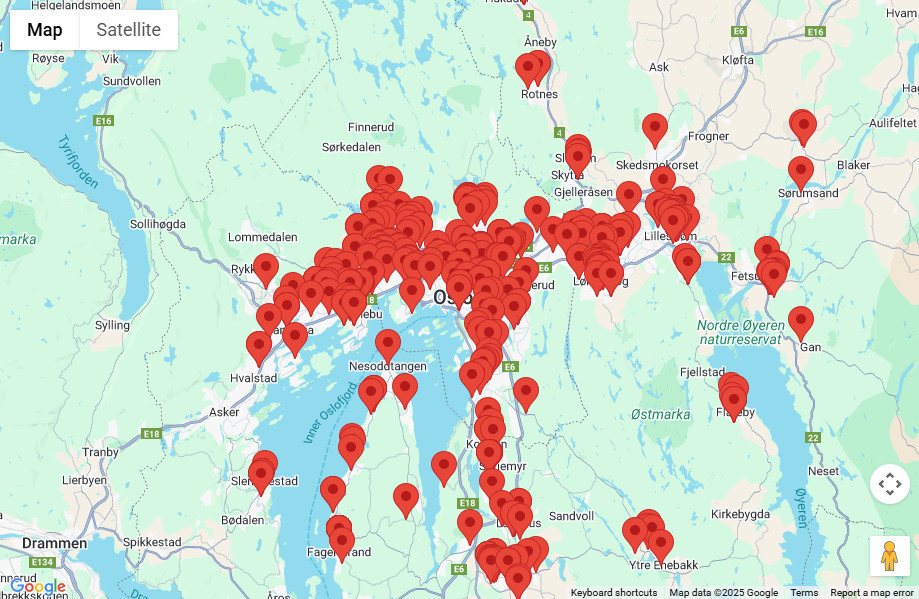
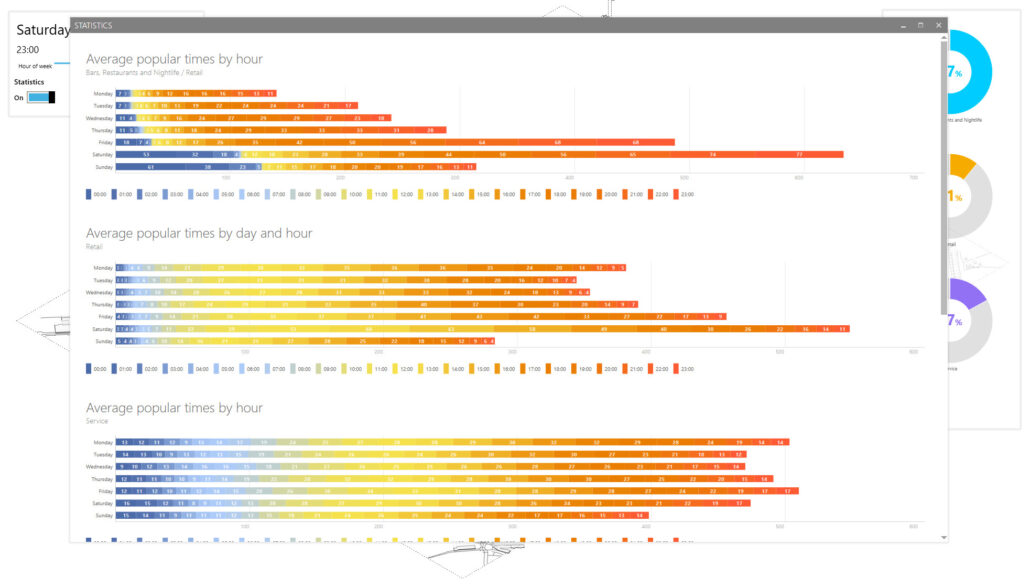
I focused on three key categories of city locations: bars, restaurants and nightlife, service establishments, and retail stores. For each venue, I gathered essential details such as the name, address, precise geographic coordinates, and the type of location, all sourced from Google APIs. Additionally, I utilised popular times data from the Google API (with a workaround – Google does not provide this data through its API), which offers an hour-by-hour overview of visitor activity throughout the week. This data allows me to pinpoint peak hours and identify trends, offering valuable insights into the busiest periods for each type of location.
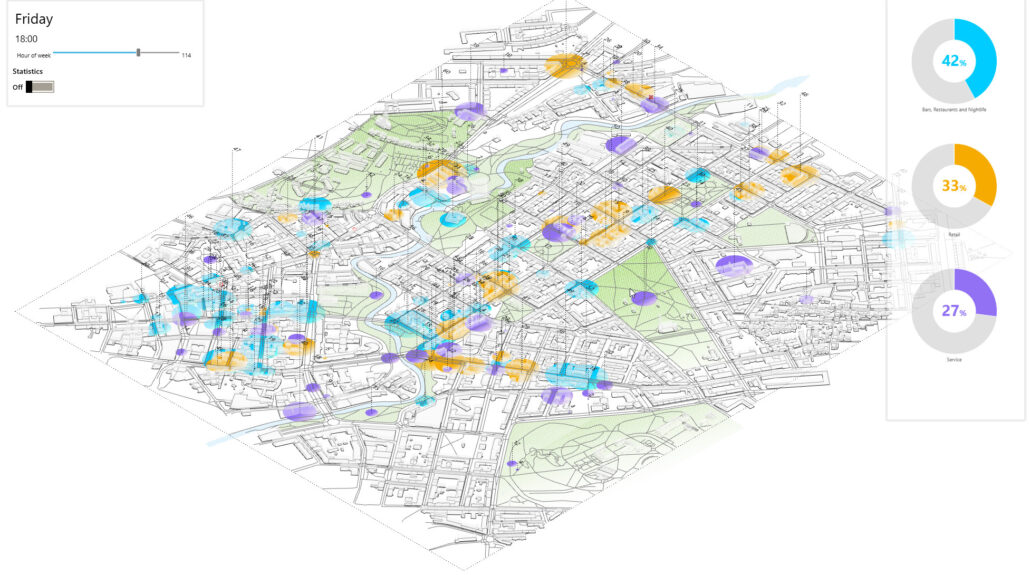
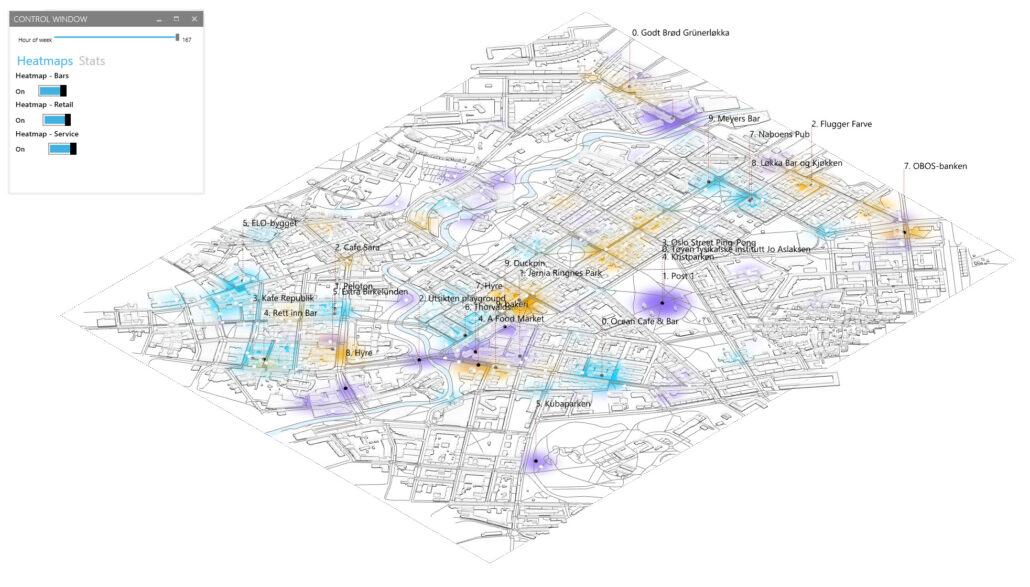
Heatmaps and 10 most popular venues by category:
Statistics dashboard:
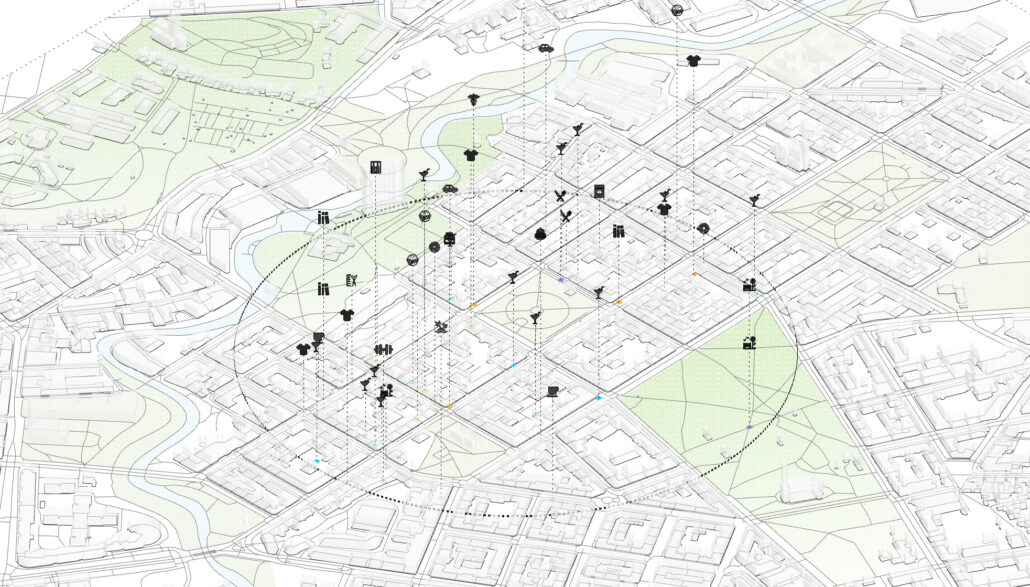
Location type, distance to and other data can be extracted within a radius around a point of interest and / or other parameters
The whole process is highly automated – the python script takes a set of coordinates and gathers the data automatically. The grasshopper definition takes the same coordinates and data in CSV format from the Python scripts and generates the dashboard and graphs. Case study No. 2 is another area in Oslo. Only the coordinates were provided and appropriate tweaking (without redoing the entire definition) was done where necessary.
Case Study No. 2 – Grønland, Oslo